The P-F Curve Explained: Definition and Use Cases in Maintenance
The P-F curve, or Prevention-Failure curve, is a graph used to identify asset reliability and performance over time. It plots the interval between an asset’s potential failure (P) and functional failure (F), which allows you to identify when preventive maintenance measures should be taken.
In this blog post, we'll explore why the P-F curve is an incredibly useful tool for helping with maintenance activities by allowing you to plan your maintenance strategy more effectively and reduce downtime due to equipment breakdowns
How does the P-F curve work?
As an asset accumulates operating hours, its expected failure rate increases. The P-F curve maintenance technique offers a way for you to see the health of equipment over time. It’s an essential tool in developing effective maintenance strategies, as it can be used to predict the optimal balance between planned and corrective maintenance procedures.
The ideal preventive maintenance program maximizes uptime while minimizing cost — this is where Brightly’s Maintenance & Operations solutions can come in handy. Our team of experienced professionals can guide you through the implementation and evaluation of a P-F curve and ensure your system runs at peak efficiency.
Reliability-centered maintenance
Reliability-centered maintenance (RCM) is a systematic method used to help organizations plan and implement effective preventive maintenance schedules. Integral to RCM is understanding the P-F curve, which illustrates the relationship between preventive and corrective maintenance.
In other words, it examines the cost of being proactive versus reactive.
For effective RCM planning, Brightly's Asset Essentials solution helps companies to optimize their assets’ performance and availability. With Asset Essentials' easy-to-use tools, companies have fully traceable asset data, accurate reporting capabilities, and visibility into inventory — meaning all maintenance-related information is tracked closely for future reference. This is critical for ensuring the optimal operation of your organization's assets.
How to read the P-F curve
The P-F curve is an important tool for analyzing the safe operating range of a piece of equipment. It helps engineers identify how well the device works under pressure or other variable conditions and can provide insight into your asset’s maintenance needs and potential upgrades required to reach maximum efficiency.
The ability to accurately read and understand these curves is essential to making informed decisions on what modifications or repairs may be necessary across your asset ecosystem.
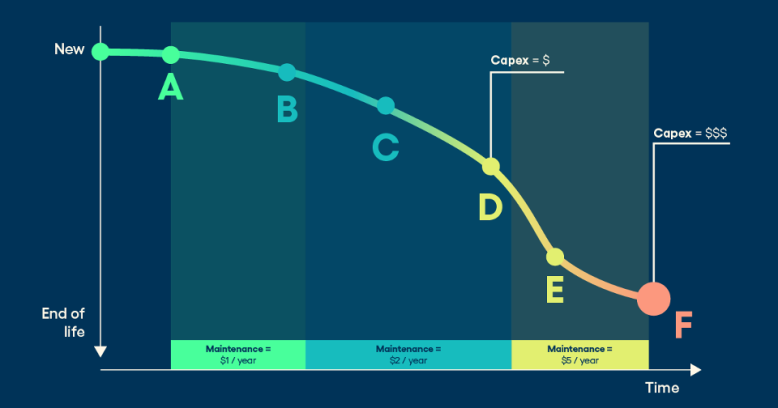
Point P: Potential failure
Point “P” on the P-F. curve marks the point where equipment failure can potential occur, which can have severe consequences on asset maintenance. For example, a conveyor system could experience power supply issues at Point P, resulting in a sudden breakdown.
To help prevent these costly disruptions, Point P helps to detect small changes in performance so that potential failures can be identified and mitigated before they occur. This preventive maintenance ensures assets and systems run smoothly, conserves time, and lowers operational costs.
Point F: Functional failure
Point “F” on the P-F curve is indicative of functional failure, which can occur when maintenance activities are neglected or not performed properly. If maintenance is not completed and updated regularly, an asset could unexpectedly malfunction and stop working altogether.
For example, if a car does not have its oil changed every 3,000 miles as recommended by the manufacturer, the engine might sustain severe damage and overheat due to lack of lubrication, rendering the vehicle useless.
Understanding what Point F means on the P-F curve is critical to preventing unplanned equipment outages and major malfunctions.
The P-F interval
The P-F interval is the most important information you need to understand in the P-F curve. It directly relates to the amount of time that a maintenance team has between detecting potential failure and when it happens.
Longer P-F intervals mean that more time is available for preventive maintenance practices to be carried out to avoid equipment interruptions or breakdowns. Regular condition monitoring and analysis in a time-based system can also ensure that the P-F intervals remain long so that appropriate maintenance can be carried out before failures occur.
How to extend the P-F interval
To improve or extend the P-F interval, there are several techniques you can apply depending on the type of asset, its intended function, and identified failure modes.
Choosing the right technique can significantly reduce the likelihood of an unexpected failure, thereby increasing an asset’s service life. However, to effectively do so, it is important to select the correct maintenance method based on a thorough evaluation of your specific requirements.
While not all assets are the same and techniques should be adjusted accordingly, some of the most common maintenance techniques used to identify an asset's condition include:
- Lubricant and sampling analysis
- Corrosion monitoring
- Motor current analysis
- Acoustic emissions detection
- Vibration analysis
- IR thermography
- Process parameter trending
- Process control instrumentation
- Visual inspections
With all these inspection methods at your disposal, you can keep track of condition changes in an asset over time to extend its failure interval.
Creating an effective preventive asset maintenance strategy can be a difficult process and requires specialized techniques. Despite these complex procedures, you can greatly simplify and improve your operations by leveraging solutions such as Brightly Asset Essentials. Brightly allows users to generate proactive maintenance plans and planned maintenance tasks that are customized to specific assets regardless of their industry.
Factors influencing the P-F interval
An asset’s failure mode is dependent on several factors, many of which can be influenced by the design and setup of the equipment. These include the asset’s construction materials, the nature and composition of the components, installation techniques, stress levels, and environmental conditions — all of which determine the P-F interval. Having clear understanding and insight into these factors is necessary to optimize an asset’s lifecycle.
Equipment design
Equipment design considerations such as safety levels and required maintenance have a significant impact on the P-F interval. These design variables can contribute to potential failure modes, including how quickly after incident onset failure occurs and the type and number of failures the equipment is experiencing.
For example, an equipment design could employ automated safety features to reduce the risk of a catastrophic failure, or it may require regular maintenance to reduce the likelihood of minor complications becoming major issues. Such thoughtful design considerations can improve the P-F interval and provide more reliable asset performance.
Equipment use
Equipment usage — including the frequency of use and adherence (or not) to manufacturer’s guidelines and regulations — can also determine the P-F interval. If any of these variables are misrepresented or unfulfilled the resulting P-F interval can be greatly increased or decreased, depending on the circumstance.
User error
User error is one of the most prevalent factors influencing the P-F interval. Manual errors made during installation, such as leaving out essential components or parts, can drastically reduce an asset’s lifecycle and performance.
Similarly, the P-F interval can be affected by manual mistakes made during operation, many of which also lead to higher maintenance costs, reduced functionality, and premature component failure. Properly training operators and engineers in the installation and usage of assets is the simplest way to avoid these technical mishaps and lengthen their reliability and lifecycle.
Operational variability
Operational variability such as frequency of use, load size, and quality of replacement parts affect an asset’s use life and impact the P-F interval. Understanding this and taking action to minimize any subpar operations will prolong the life of assets and minimize costly reactive maintenance.
How to use the P-F curve for more effective maintenance planning
The P-F curve is a powerful tool for team leaders, as it can help optimize and streamline the maintenance planning process. By analyzing performance metrics over time, it enables proactive and preventive maintenance strategies to be developed.
This predictive approach allows problems to be identified and addressed before they cause issues with production, drastically reducing downtime and costs incurred when reactively fixing asset failures.
Leveraging the P-F curve helps maximize efficiency in maintenance operations while still providing quality service at an affordable price. Here are some tips on how to do it.
Schedule preventative maintenance
The P-F curve, or probability-failure curve, is a powerful tool for maintenance teams to plan and schedule preventive maintenance. Using the P-F curve, maintenance workers can identify potential failure modes of their assets or machines and schedule maintenance before it becomes a crisis, effectively maximizing asset performance, long-term efficiency, and lowering operational costs.
Identify risks
Maintenance personnel can also use the P-F curve to quickly identify risks associated with assets and their potential functional failures. The points in the curve provide a visual representation of when an asset failure may take place, helping workers prioritize services according to the severity of the risk.
This risk assessment prevents costly shutdowns and the use of under-maintained assets. Armed with these insights, maintenance teams can improve predictive maintenance planning to ensure that all assets are monitored and costs are reduced.
Extend asset life
By pinpointing the impending failure of an asset, maintenance personnel are better able to schedule routine or corrective measures for system components and optimize the life of those components. This process can help extend asset life by replacing the component just prior to failure. Ultimately, this enhances productivity and reduces system downtime and cost due to catastrophic failure or unplanned outages.
Establish a maintenance strategy
Planning and taking proactive measures are key steps to ensure effective maintenance operations. The P-F curve, which visually displays the balance between planned maintenance and repair costs, offers insight into when assets may fail, allowing facility managers to plan for these potential outages and establish a tailored maintenance approach.
By utilizing the curve’s information, organizations can develop a reliable strategy that best suits their needs, such as when preventive or predictive maintenance techniques should be implemented instead of relying on reactive solutions. Having the data to back up decisions leads to increased efficiency and cost savings that help contribute toward long-term success.
Optimize your maintenance strategy with Brightly’s CMMS solutions
Brightly's computerized maintenance management system (CMMS) solutions are designed to help organizations optimize their maintenance strategies, improve their preventive and corrective maintenance routines, and maximize the P-F interval.
With Asset Essentials, businesses gain access to an easy-to-use platform that allows them to manage work orders, automate preventive maintenance scheduling, monitor inventories and usage patterns, plan overhauls, promote safety best practices and track energy usage.
Through this comprehensive set of CMMS tools, Brightly helps customers reach peak performance levels while reducing costs. If you're looking for a quick and efficient way to bring your maintenance processes up to date, Brightly is your ideal partner.

